![Why Developer Leaderboards Drive Real Engineering Wins [+ Real Data]](/blog/developer-measurement-problem-engineering-metrics.png)
TL;DR: Most engineering teams have no scoreboard. Main-branch-only analytics makes 80% of engineering work invisible, so engineers doing foundational work get no credit and eventually leave. A developer leaderboard backed by all-branch data addresses all four drivers of intrinsic motivation: autonomy, mastery, purpose, and recognition. According to Warclick platform data (Q1 2026), teams that add all-branch leaderboards see a 75.8% increase in overall activity within the first quarter. One team tracked zero departures in a six-month window after rollout, against a historical baseline of 3–4 expected attritions.
The Measurement Problem No One Talks About
You're trying to manage what you can't see.
Your team pushed 400 commits last month. Solid quarter, right? That number only counts what made it to your main branch. The feature branches, the experimental work, the code reviews, the junior dev who quietly refactored your authentication layer on a side branch — none of that shows up.
Most engineering analytics tools share the same blind spot. They measure production output and call it "developer productivity." Production output is the tip of the iceberg. Underneath, there's a massive volume of work that never surfaces: branches that get squashed, experiments that inform architecture decisions, reviews that catch bugs before they ever reach staging.
When you can't see the work, you can't recognize the people doing it. When people don't get recognized, things start to break.
We wrote about the all-branch visibility gap in depth here.
What Happens When You Make Engineering Work Visible
The moment you put developer activity on a leaderboard, one that tracks all branches and not just main, three things shift in your team dynamics.
Healthy Competition Replaces Apathy
Engineers are builders. They're naturally competitive about craft. Most teams have no scoreboard. Imagine a basketball team that never kept score during practice. Would players push themselves the same way?
When developers can see their rank relative to peers, across commits, reviews, PRs merged, and coding days, something clicks. The developer who reviews 150 pull requests finally gets the same visibility as the developer who ships flashy features. The system stops rewarding only the loudest contributors.
One team Warclick works with saw a 75.8% increase in overall activity within the first quarter of turning on leaderboards. Not because people started gaming metrics. Because people who were already doing great work finally had a reason to keep going.
Hidden Talent Surfaces
Every engineering org has quiet performers. The developer who mentors three juniors but never gets credit in standups. The code reviewer who catches critical bugs at 11 PM. The infrastructure engineer whose work is invisible until something breaks.
Traditional metrics make these people ghosts. Leaderboards with all-branch visibility make them visible.
When a VP of Engineering at one Warclick customer first saw their all-branch leaderboard, the reaction was immediate: the people they assumed were top performers weren't even in the top five. The actual top contributors were mid-level engineers doing foundational work on feature branches that never showed up in main-branch analytics.
It happens everywhere teams only measure a fraction of the work.
Read the full case study on how this team scaled from 22 to 38 engineers.
Burnout Prevention Through Fair Recognition
Good developers quit when their work is invisible. Not always because of compensation. Because their effort doesn't register.
A developer who spends three months building a critical library on a feature branch, while their manager's dashboard shows zero activity, gets a clear message: your work doesn't count.
Bad metrics drive bad behavior: commit spam to look productive, fake velocity, politicking for visible projects instead of important ones. Leaderboards based on actual, complete work data feel fair. Fair feels sustainable.
The Psychology: Why Leaderboards Tap Into What Engineers Actually Want
Daniel Pink's research on intrinsic motivation identifies three core drivers of performance: autonomy, mastery, and purpose. For engineering teams, there's a fourth element that leaderboards uniquely provide: recognition.
Autonomy: I Can See My Own Impact
When engineers can view their contribution data across all branches, they gain self-awareness about their work patterns. They don't need a manager to tell them they had a slow week. They can see it themselves and self-correct. That's autonomy in action.
Mastery: I'm Getting Better at My Craft
Leaderboards over time become personal scorecards. Engineers can track their own trajectory: are they reviewing more code this quarter, shipping more consistently, expanding into new repos? The leaderboard becomes a mirror for growth, not just a ranking.
Purpose: My Work Matters to the Team
When your contributions are visible to the entire team, you feel connected to the mission. That PR review you did at midnight? It shows up. That infrastructure fix nobody noticed? It's on the board. Purpose comes from knowing your effort counted.
Recognition: Someone Sees What I Built
Autonomy, mastery, and purpose alone aren't enough. Without recognition, motivation erodes over time. Leaderboards close this gap by making contributions visible not just to the individual, but to the team and leadership.
Leaderboards + all-branch visibility = all four motivation drivers met.
See what your team's leaderboard looks like. Warclick tracks every commit, PR, and review across all branches, not just main. Start a free trial, no credit card required.
What Leaderboards Are NOT (And How to Avoid the Pitfalls)
The word "leaderboard" can sound like a recipe for toxic competition. Here are the guardrails that prevent that:
Not Forced Ranking
A leaderboard is a tool, not a policy. Show the data. Let teams decide how they use it. Some teams will rally around climbing together. Others will use it for self-reflection. Both are valid.
Not a Stick
A leaderboard is a mirror. The team's own competitive instinct drives results, not management pressure. The moment you use a leaderboard to punish underperformers, you've broken the tool. Use it to understand context. A developer ranked low might be onboarding, doing architectural work that doesn't show in commit volume, or dealing with something personal. The leaderboard surfaces the question. The conversation provides the answer.
Not for Every Culture
Some team cultures will resist leaderboards. That's data too. If your team rejects visibility, that tells you something important about trust levels and psychological safety. Address those first.
The Numbers: What Leaderboards Actually Produce
We're not going to repeat the full case study here — you can read the complete breakdown — but here are the headline numbers from introducing leaderboards alongside all-branch visibility:
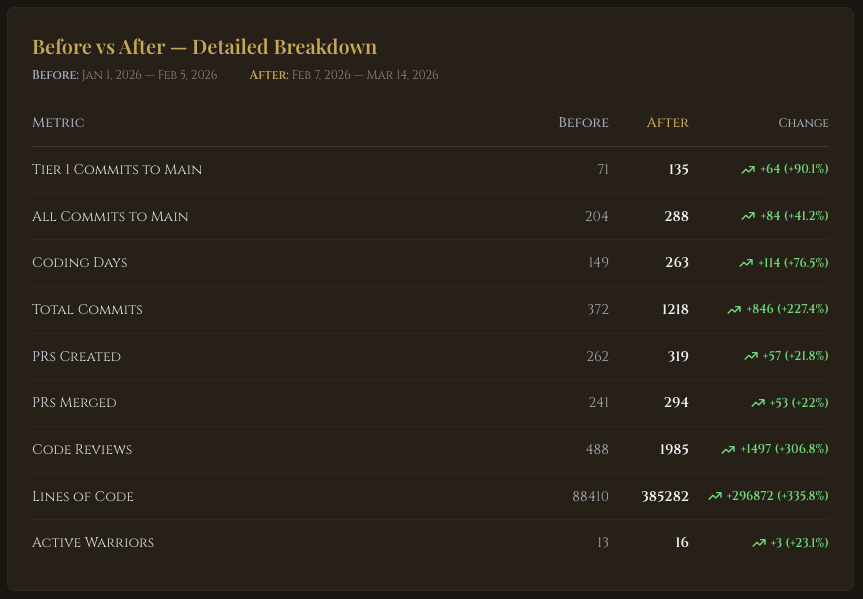
The commits number is dramatic, but the retention number is the real story. When engineers feel seen, they stay.
AI adoption data played a role too. Here's what we found across hundreds of engineers.
How to Get Started: A 30-Day Test
You don't need to overhaul your engineering culture overnight. Here's a low-risk way to test whether leaderboards work for your team:
Week 1: Connect your GitHub repos to an all-branch analytics tool. Look at the data yourself first. Compare what you see to your assumptions about who's productive.
Week 2: Share the aggregate data, not individual rankings, with your team. Frame it as discovery: "Here's what we're actually building across all branches."
Week 3: Turn on the leaderboard for your team. Make it opt-in or read-only at first. Watch how people respond.
Week 4: Run a retrospective. Did activity change? Did conversations change? Did anyone surface who was previously invisible?
We built a detailed 30-day playbook if you want the step-by-step guide.
If the results are positive, you'll know within 30 days. If they're not, you've lost nothing but a few minutes of setup time.
Healthy competition beats arbitrary metrics every time. Warclick gives your engineering team all-branch visibility, fair leaderboards, and the recognition they deserve, starting at $4/warrior/month. Try it free for 7 days.
Frequently Asked Questions
What is a developer leaderboard in engineering?
A developer leaderboard is a ranked view of individual engineering contributions, including commits, pull requests, code reviews, and coding days, that's visible to the entire team. Unlike private performance dashboards, leaderboards are shared transparently so every contributor can see their standing relative to peers. The key design choice is what data feeds the ranking: main-branch-only counts underrepresent most contributors, while all-branch data shows the complete picture including feature branches, experimental work, and review activity.
Do developer leaderboards create toxic competition?
In practice, all-branch leaderboards tend to create healthy competition rather than toxic competition, because the data feels fair. When engineers know every contribution is counted — including reviews, feature branch commits, and coding consistency — gaming the system becomes less appealing than doing good work. The risk arises when leaderboards are used to punish underperformers or tied directly to compensation decisions. Used as a mirror rather than a weapon, they drive recognition-based motivation without the dysfunction associated with forced ranking systems.
Why do engineering leaderboards improve retention?
Engineers leave when their work feels invisible. A developer who spends months building a critical library on a feature branch, while their manager's dashboard shows zero activity, eventually concludes their contributions don't matter. All-branch leaderboards solve the invisibility problem by surfacing every commit, review, and coding day regardless of whether work has merged to main. According to Warclick platform data (Q1 2026), teams with all-branch visibility report lower attrition than teams using main-branch-only measurement. The mechanism is straightforward: recognition is one of the four core drivers of intrinsic motivation, and leaderboards provide it at scale.
What metrics should an engineering leaderboard include?
Effective engineering leaderboards track at least four dimensions: overall impact score (a weighted composite), code review participation (who's giving the team their attention), pull request activity (who's shipping), and coding days (who shows up consistently). Warclick's Clan Leaderboard uses exactly this structure, with separate rankings for Champions (overall score), Guardians (reviews), Berserkers (PRs), and The Unyielding (coding days). The multi-dimensional approach prevents gaming, since optimizing for any one metric doesn't fully improve your standing across all four.
How is a developer leaderboard different from a performance review?
A leaderboard is a real-time, transparent mirror of contribution data. A performance review is a periodic, private evaluation by a manager. The two serve different purposes and should not be conflated. Leaderboards drive day-to-day motivation and team visibility. Performance reviews assess growth, compensation, and role fit. Using leaderboard data as the basis for performance decisions without additional context turns a motivational tool into a surveillance instrument, and usually destroys adoption across the team.