TL;DR: Most teams waste their first month with engineering analytics by sharing dashboards before they understand what they're looking at. This 30-day playbook walks engineering leaders through six phases — connect, calibrate, invite, measure, act, and optimize — one disciplined step per week. The principle: trust before metrics.
Why Most Teams Waste Their First Month with Analytics Tools
You've connected Warclick to your GitHub. The data is flowing. Now what?
Most engineering leaders do the same thing: they glance at dashboards for a week, show someone a chart in a meeting, then forget the tool exists by month two. The problem isn't the tool — it's the rollout. Analytics platforms fail when leaders treat them like passive dashboards instead of active management instruments.
This playbook is the exact sequence that works. It's built from patterns we've observed across teams that successfully adopted Warclick and saw measurable improvements in visibility, review distribution, and team engagement within their first 30 days.
The key principle: trust before metrics. Your team needs to understand why you're measuring before they'll accept what you're measuring.
Day 1: Setup (It Takes 30 Minutes, Not 30 Days)
An engineering analytics rollout is the process of introducing objective team measurement — from any tool — without eroding trust. Warclick is designed to make this fast, but the discipline still matters.
One of the reasons engineering analytics tools fail is that setup takes forever. Enterprise platforms need weeks of configuration, integration meetings, and SSO wrangling before anyone sees a single data point. Warclick is designed to eliminate that friction entirely.
Step 1: Connect GitHub (15 Minutes)
Go to Warclick.com, start the free trial (no credit card required), and install the GitHub App on your organization. You'll authorize the app for read-only metadata access to commits, PRs, and reviews. Warclick never touches your source code or makes any writes to your repos. We highly recommend selecting all repositories to ensure full visibility, but a subset is perfectly fine. Once the app is installed, the initial backfill sync runs. Depending on your repo sizes and history, this can take 15 minutes to 2 hours.
The critical difference here: Warclick pulls data from every branch, not just the default (often "main"). This means your backfill will surface work that most other analytics tools have never shown you. Don't be surprised if commit counts are 3–5x higher than what you're used to seeing.
Step 2: Configuration (10 Minutes)
Warclick will take its best guess at team member roles — engineers, PMs, etc. — create your teams based on what you have in GitHub, and auto-tier your repositories. You'll want to click through the Settings/Warriors, Settings/Tribes, and Settings/Repositories pages for the best results.
Step 3: Explore the Data Yourself
Before you invite anyone else, spend the rest of Day 1 familiarizing yourself with the dashboards. Look at the War Room, browse warrior profiles, check the leaderboard. Get a feel for your baseline before sharing it with anyone.
Day 2: Calibrate Your Understanding
Resist the urge to share dashboards immediately. Day 2 is about calibrating your intuition against actual data.
What does the War Room actually show you?
This is the most important dashboard in Warclick, and it's the one that surprises every new user. You'll see total commits, PRs, reviews, and most importantly, impact scores that represent activity across all branches, not just main. You can configure your impact score in Settings/Scoring to incentivize the activities you value most. For example, if cycle times are too slow as reviews pile up, put more weight into that. If you value consistency and grit, put more weight into coding days.
The gut check: Does this data match your intuition about who's productive? If it doesn't — and for most leaders, it won't — you've just discovered "dark work." That's the invisible effort your team has been putting in that no one could see until now.
We wrote about why feature branch data changes everything here.
Who's doing most of your code reviews?
Pull up the review dashboard and look at who's doing the heavy lifting. In almost every team we've onboarded, the pattern is the same: 2–3 people handle 70% or more of all code reviews. Everyone else does a handful.
That's a bottleneck. If your top reviewer goes on vacation, your entire PR pipeline stalls. This is one of the simplest, most actionable, insights you'll get immediately.
AI Adoption Dashboard
Check the AI detection view. What percentage of your team is using AI coding tools? Which tools — Claude, Copilot, Cursor? If adoption is below 50%, you have an upskilling opportunity. If it's above 80%, you should lean into AI-first onboarding for new hires.
Here's what AI adoption looks like across engineers on the platform as of March 2026.
Attribution Check
Be sure to watch the Settings/Warriors page to ensure attribution is spot on. Warclick automatically identifies aliases for your org members, grouping "Colin Contributor" with "colin-contribs" together, but it can miss some groupings. Fix any mismatches now so the data is clean when you share it.
Day 3: Invite Your Team
Once you've looked at the data and feel confident in the baseline, it's time to bring your team in. There's no need to create accounts — their GitHub logins are used for authentication. Simply inform your team that you have a new reporting tool for GitHub and share the link.
How should you introduce engineering analytics to your team?
How you introduce engineering analytics to your team determines whether they embrace it or resist it. Frame it like this:
"We connected Warclick to get a better view of what we're actually building. It measures all branches, all reviews — not just main. I wanted to show you the data because it's yours."
That framing — "it's yours" — is critical. You're not surveilling them. You're giving them visibility into their own contributions.
What to Highlight
Walk through four things: overall commits and reviews across the team (aggregate, not individual), the all-branches discovery ("we're building significantly more than our old tools showed"), AI adoption trends ("here's how our team is using AI tools"), and code review distribution ("we have an imbalance we should address").
Ready to see what your team is actually building? Warclick captures every commit across every branch — not just main. Setup takes 30 minutes. Start Your Free 7-Day Trial.
Week 1: Measure the Warclick Impact
Week 1 is the make-or-break moment. You'll notice that engineers who log in begin increasing their contributions. We are all competitive — it's in our nature. Your best builders will lean in to hold that top spot, others will push to get their names higher on the leaderboards. Marketing, sales, operations, support teams — they all have leaderboards for a reason. They objectively show you who's crushing it and who's stuck.
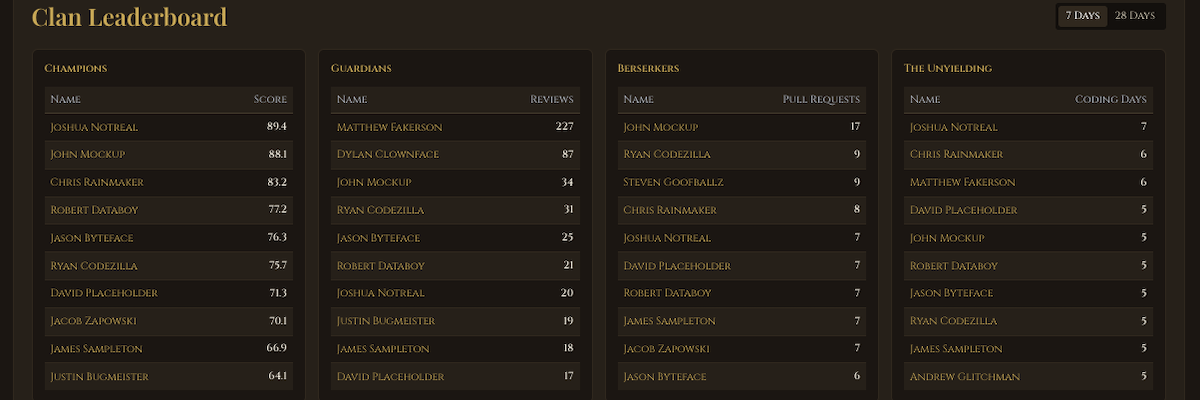
The Leaderboard (Clan Table)
The Clan Leaderboard doesn't just rank by a single number. It breaks contributions into four categories: Champions (overall impact score), Guardians (code reviews), Berserkers (pull requests), and The Unyielding (coding days). This means different types of contributions are recognized — the quiet reviewer gets visibility alongside the prolific committer.
Ask yourself: Are the top 5 warriors your expected high performers? Are the bottom 5 actually underperforming, or are they doing invisible work on branches you weren't tracking before? The answers will surprise you.
The psychology of why leaderboards drive engineering performance.
Weeks 2–3: Set One Goal and Act on It
You have data. You've shared it with your team. Now it's time to act — but only on one thing. Trying to fix everything at once is how analytics initiatives stall. Pick the highest-leverage problem and commit to it for 30 days.
Option A: Fix the Code Review Bottleneck
If 2–3 people are doing 70%+ of reviews (they probably are), this is your biggest scaling blocker. Pair your top reviewers with 2–3 junior engineers in a shadow pattern — juniors co-review alongside seniors for two weeks, then take on reviews independently. Goal: distribute review load and shorten PR cycle time. Warclick tracks review distribution daily, so you'll see the shift in real time.
Option B: Accelerate Onboarding with AI
If AI adoption is below 50%, share setup guides for Claude and Copilot with the team. If it's above 80%, use Warclick's AI adoption data to show how AI-enabled engineers ramp up faster — typically reaching productivity in 6 weeks instead of 3 months.
Option C: Recognize Your Hidden Performers
Use the all-branches data to identify 3–5 engineers doing great work that was previously invisible. Give them public recognition — in all-hands, Slack, or your team retro. This sounds simple, but it's one of the highest-impact things you can do. Engineers who feel seen stay longer and contribute more.
Pick one. Commit for 30 days. Measure the result.
Week 4: Review Results and Optimize
After a month of building trust and acting on data, your team has context. They understand what Warclick measures and why. Now you can lean into deeper optimization.
The Retrospective
Run a retro focused on the data. Did activity change? Did conversations change? Did anyone surface who was previously invisible? Did the goal you set in Week 2 move the needle?
Tuning the System
Make it transparent. Everyone sees the same metrics. No hidden dashboards for leadership.
Make it fair. The leaderboard tracks all branches, all work types — not just commits to main. Code reviews, PR participation, and coding days all factor in.
Make it contextual. A developer ranked low might be onboarding, doing architectural work, or focused on mentorship. The leaderboard surfaces questions. Conversations provide answers.
Make it team-building. Frame it as "how can we all climb together?" not "who's at the bottom?"
Some teams take to leaderboards immediately. Others need more time. If your team resists, don't force it — that resistance is data about your team's trust levels and psychological safety.
Common Pitfalls That Kill Analytics Adoption
Optimizing for the Metric Instead of the Outcome
"Commits are up 20%" is not a win. "Commits are up 20%, cycle time is down 30%, and team satisfaction is improving" — that's a win. Always tie metrics back to outcomes that matter: shipping speed, quality, retention, and team health.
Using Data as a Stick
Warclick is a mirror, not a weapon. The moment you use analytics to justify a PIP or firing, you've poisoned the well for the entire team. Use data to understand context, identify bottlenecks, and recognize contributions. Never to punish. Warclick helps you have informed data-driven conversations.
Ignoring Quality
Volume without quality is noise. If your team ships 2x more code but defect rates spike, you haven't improved — you've traded one problem for another. Always pair volume metrics with quality signals.
What Success Looks Like by Month 2
If you've followed this playbook, here's where you should be after 60 days: your team knows they're measured fairly and across all their work, code review bottlenecks are being actively addressed, hidden contributors have been recognized and feel valued, leadership understands what the team is actually shipping, and retention is stable or improving.
The teams that succeed with engineering analytics aren't the ones with the fanciest dashboards. They're the ones that pair data with trust, act on one thing at a time, and treat visibility as a gift to their engineers — not a surveillance tool.
Start your 30-day rollout today. Warclick gives you all-branch visibility, fair leaderboards, and AI adoption tracking — setup takes 30 minutes, not 30 days. Free for 7 days, no credit card required. Start Your Free Trial.
Frequently Asked Questions
How long does a Warclick rollout take end-to-end?
Setup takes about 30 minutes. The data calibration, team invitation, and first focused action take a full 30 days if you follow this playbook. Teams that skip steps — especially the Day 2 calibration — usually lose momentum by Week 2.
Should I share dashboards with engineers immediately?
No. Spend Days 1–2 calibrating your own understanding first. Sharing noisy or unfamiliar data before you can contextualize it is the fastest way to damage trust. Frame the rollout as a tool for the team — "it's yours" — rather than a tool for leadership.
What if my team resists being measured?
Resistance is data. It usually signals low psychological safety or a history of metrics being used punitively. Don't push. Use Warclick's leadership view privately to identify review-load imbalances and hidden contributors, and bring those insights to the team as acts of recognition — not enforcement.
Can I use Warclick data for performance reviews?
We recommend against it. Warclick is a mirror, not a weapon — a tool for informed conversations and for surfacing patterns that surveys and gut feel can't catch. Using it as the basis for performance actions turns it into surveillance, which poisons adoption across the team.
How do I know if the rollout is working?
By Day 30 you should see at least three signals: review-load is less concentrated than at Day 1, at least one previously-invisible contributor has been publicly recognized, and your team can describe what Warclick measures without prompting. Missing any of these is a sign to revisit Weeks 2–3.