TL;DR: Most engineering teams measure AI adoption with surveys — which measure intent, not behavior. In a Warclick analysis of a 25-engineer mid-size team over 28 consecutive days (Q1 2026), 84% of engineers used AI tools with an 84.1% AI commit rate — meaning more than 8 out of 10 commits had AI involvement. Claude was the dominant tool by a wide margin. Across the broader Warclick platform (Q1 2026), adoption rates average 87% but AI commit depth varies dramatically — from 5% to over 90% of commits per team. The key finding: depth of adoption, not breadth, predicts workflow transformation.
The Question Every CTO Is Getting Right Now
Every engineering leader is fielding the same set of questions from their CEO, their board, or their own curiosity:
"How many of our devs are actually using AI?" "Is it making us faster, or just making us feel faster?" "Are we falling behind competitors who've adopted earlier?" "Should we mandate AI tools or let adoption happen organically?"
The problem: until now, there's been no reliable way to answer any of these questions. Most organizations rely on surveys ("raise your hand if you use Copilot"), self-reporting (notoriously inaccurate), or gut feeling ("it seems like more people are using it").
Surveys measure intent. They don't measure behavior. An engineer who says they use AI might open Copilot once a week for autocomplete. An engineer who says they don't might be routing every architectural decision through Claude without thinking of it as "AI usage."
We decided to measure what actually happens in the code.
How We Measure AI Adoption (It's Not What You'd Expect)
AI adoption measurement is the practice of detecting AI tool usage from commit metadata, authorship signals, and behavioral patterns — rather than relying on self-reported surveys. Warclick doesn't ask engineers to self-report. Instead, we analyze commit metadata, authorship patterns, and behavioral signals across every branch in every repository. Our full methodology is documented on our AI detection methodology page.
How does Warclick classify AI-assisted commits?
Not all AI-assisted code looks the same, so we classify every commit into one of three confidence tiers:
Confirmed. The commit contains explicit proof of AI tool usage — a machine-generated tag, a known bot account, or a tool-specific signature embedded in the commit metadata. These are definitive.
Likely. The commit shows strong behavioral patterns consistent with AI-assisted workflows — structured formatting, detailed descriptions, and cadence signals that distinguish AI-generated messages from hand-written ones. These are high-confidence heuristics calibrated against known AI and non-AI users.
Manual. No AI signals detected. The commit appears to be written entirely by hand.
The three-tier approach matters because binary classification (AI or not-AI) is too crude. The reality is a spectrum, and engineering leaders need to understand where on that spectrum their team falls.
What We Look For
Our detection engine examines multiple dimensions of every commit: tool-specific attribution tags and co-author signatures from Claude, Cursor, Windsurf, Copilot, Aider, Devin, and others. Bot accounts and agent identities. Commit message structure, length, and formatting patterns. Development velocity and cadence — burst patterns, timing, and frequency.
We continuously expand our detection as new AI tools emerge and existing tools evolve their commit signatures.
Inside a Real AI Adoption Report
Let's look at a real Warclick AI Adoption Report. This is from a mid-size engineering team — 25 active contributors measured over a 28-day window in Q1 2026. The data is anonymized, but the engineering activity is real. You can download the full report PDF to see every chart and table.
Headline Metrics
- 84% adoption rate — 21 of 25 engineers used AI tooling during the 28-day observation period
- 84.1% AI commit rate — 2,926 of 3,481 total commits were classified as AI-assisted
- Claude is the dominant tool — 1,547 confirmed commits, far ahead of Cursor, Windsurf, and others combined
- 80.8% evidence quality — the majority of AI classifications are verified by explicit co-authored-by tags, not just heuristics
That AI commit rate is the number that surprises people. More than 8 out of 10 commits had AI involvement. AI-assisted development has become the default workflow for this team — not an occasional accelerant.
How This Team Compares to the Platform
Warclick benchmarks every company against aggregated platform averages (Warclick platform aggregate, Q1 2026). Here's where this team stands:
| Metric | This Team | Platform Avg |
|---|---|---|
| Adoption Rate | 84% | 87% |
| AI Commit Rate | 84.1% | 55% |
| AI Lines of Code | 89.4% | 59% |
| Confirmed AI | 63% | 20% |
Their adoption rate is close to the platform average, but their depth of AI usage is far above it. 84.1% of commits vs. 55% platform-wide. And their confirmed rate — commits with definitive AI proof — is 3× the platform average. This team isn't just using AI occasionally. It's their primary workflow.
AI Adoption by Discipline
The report breaks down AI usage by role, and the results are revealing:
- Product Managers: 98.8% AI rate — nearly every commit AI-assisted
- Engineers: 87.8% AI rate — the core engineering team is deeply adopted
- DevSecOps: 83.5% AI rate — infrastructure and security work is also heavily AI-assisted
The product manager number is striking. When non-engineers who contribute code are doing so almost entirely with AI assistance, it signals a fundamental shift in who can participate in the codebase.
The Usage Tier Breakdown
Warclick classifies each contributor into usage tiers based on their overall AI rate. On this team: 19 of 25 are "Heavy" users (60%+ AI rate), only 1 is "Moderate," and 5 are fully "Manual." There's almost no middle ground — engineers either go all-in on AI or don't use it at all.
The 5 engineers at 0% AI usage aren't necessarily anti-AI. They may work on tasks where AI tools are less applicable, or they may not have adopted yet. Either way, the data surfaces the question so leadership can have informed conversations.
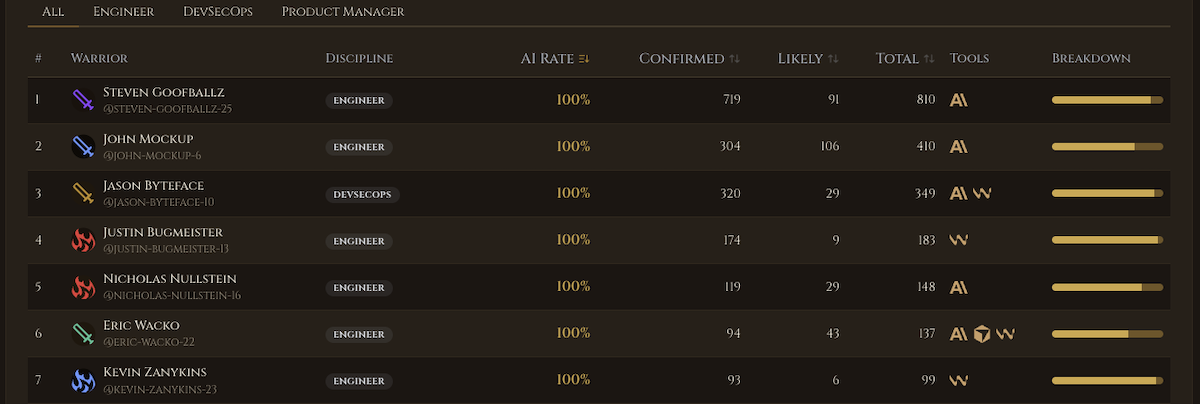
Top AI Adopters
The report's leaderboard shows the top contributors ranked by AI rate. Seven of the top contributors have a 100% AI rate, every single commit classified as AI-assisted. The top contributor alone has 810 commits in 28 days, with 719 confirmed and 91 likely. An engineer pushing 810 commits in 28 days has built their entire workflow around AI tools.
Download the full sample report to see every chart, trend line, and breakdown.
What's your team's real AI adoption rate? Stop guessing. Warclick measures AI tool usage across every commit, every branch, every engineer — no surveys required. Start Your Free 7-Day Trial.
What the Data Reveals About How Teams Actually Adopt AI
Across the hundreds of engineers we've measured on the platform, several patterns emerge consistently.
Why do teams converge on a single AI tool?
In this sample report, Claude dominates — 1,547 confirmed commits vs. the rest combined. This isn't unique to this team. Across the Warclick platform (Q1 2026), teams consistently standardize on one primary AI tool rather than fragmenting across many. The convergence makes sense: shared context, consistent code style, and easier onboarding all favor a single tool. When your whole team is using Claude, new engineers can read AI-generated code and prompting strategies from teammates rather than starting from scratch.
If you're onboarding new engineers, AI adoption data should inform your first-30-days playbook.
Do junior or senior engineers adopt AI coding tools faster?
The adoption curve inverts what most leaders expect. Junior engineers adopt AI tools faster than seniors — consistently, across every team we've measured. This makes sense: juniors face more friction — unfamiliar codebases, boilerplate they haven't memorized, questions they'd normally ask on Slack — and AI tools remove exactly that friction.
Senior engineers adopt more slowly but use AI for higher-leverage tasks: architecture decisions, complex refactoring, code review assistance, and documentation. Their usage is less frequent but more impactful per interaction. The result is that junior AI adoption correlates strongly with shorter ramp-up times, while senior AI adoption correlates with higher-quality PR descriptions and more thorough code review feedback.
AI Depth Matters More Than AI Breadth
The sample team's adoption rate (84%) is actually slightly below the platform average (87%). But their AI commit rate is 84.1% vs. 55% platform-wide. The lesson: it's not enough to know how many people have AI tools installed. You need to know how many commits are AI-assisted. A team where 90% of engineers have Copilot but use it for 5% of commits is in a fundamentally different place than a team at 84% adoption and 84% AI commit rate.
Does AI Adoption Actually Improve Performance?
This is where the conversation gets interesting. High adoption sounds good, but does it translate to better engineering outcomes?
Short answer: yes, but not how you'd expect.
Friction Removal, Not Just Speed
The obvious narrative is "AI writes code faster, so teams with AI ship more." That's partially true, but it misses the bigger picture. AI's primary impact isn't speed. It's friction removal.
Consider what slows engineers down on a typical day: unfamiliarity with a codebase section, boilerplate that's tedious but necessary, waiting for a teammate to answer a question, writing tests for code they've already built, documenting decisions and architecture. AI tools address every one of these friction points without requiring anyone to go faster.
Junior Engineers Become Productive Faster
Teams with high AI adoption consistently report faster new-hire ramp-up. Junior engineers ask Claude before asking Slack. They get instant context on unfamiliar code. They can scaffold a new feature without memorizing every pattern in the codebase first.
This doesn't replace mentorship — it augments it. Seniors spend less time answering routine questions and more time on the architectural guidance that actually requires human judgment.
Async Work Becomes Viable
AI tools enable meaningful async work at odd hours. An engineer working at 11 PM can use Claude to answer the questions they'd normally wait until morning to ask a teammate. AI-generated PR descriptions, commit summaries, and code review assistance mean that async collaboration carries less information loss.
For distributed teams or teams spanning time zones, this compounds into a significant productivity multiplier.
Why Most "AI Adoption" Measurements Are Useless
Your competitor's blog post says "85% of our team uses ChatGPT." That tells you almost nothing.
Why are binary AI adoption metrics misleading?
Binary AI measurement — "uses AI" vs. "doesn't use AI" — is too blunt to drive any useful decision. An engineer who uses Copilot for autocomplete once a week and an engineer who routes every design decision through Claude are both counted as "AI users," but their impact on team productivity is vastly different. Binary metrics create the illusion of insight while hiding the actual story.
Better Questions to Ask
Instead of "what percentage of my team uses AI?", engineering leaders should be asking:
What percentage of commits are AI-assisted? This measures actual impact, not intent. If 84% of your commits have AI involvement, that's a fundamentally different workflow than 84% of people having AI tools installed.
What's the evidence quality? Are your AI classifications based on verified tags (confirmed) or behavioral heuristics (likely)? Warclick's transparent detection methodology shows you the confidence tier behind every classification.
Which stages of the pipeline involve AI? Is AI in the design phase? Coding? Code review? Testing? The most advanced teams use AI across the entire pipeline, not just in the editor.
How does adoption correlate with retention? In our platform data (Q1 2026), teams with high AI adoption and all-branch visibility have lower reported attrition than teams with low adoption.
AI adoption data is only useful if you're measuring all branches — here's why.
What to Measure Starting Today
If you want to understand your team's real AI adoption — not just whether people have tools installed — here's the framework:
Volume Metrics
Track the percentage of commits with AI assistance and the percentage of PRs with AI involvement. These give you a baseline for how deeply AI has penetrated your workflow. Anything below 40% AI commit rate suggests AI tools are being used as accessories rather than primary workflow tools.
Velocity Metrics
Measure cycle time from first commit to production. Compare AI-assisted PRs vs. manual PRs. In most teams, AI-assisted work moves through the pipeline faster — though the magnitude of the difference depends heavily on the team's review culture.
Quality Metrics
Monitor defect rates, code review feedback cycles, and test coverage over time. AI adoption without quality measurement is dangerous — you want to confirm that speed gains aren't accompanied by quality regressions.
Team Health Metrics
Track code review participation, knowledge sharing patterns, and junior developer ramp-up time. These are the second-order effects of AI adoption that matter more than raw speed in the long run.
The Takeaway: Measure Behavior, Not Intent
AI adoption in engineering isn't a binary switch. It's a spectrum that changes how teams work, who can be productive, and how fast new engineers contribute.
But you can't manage what you can't measure. Surveys and self-reporting give you a distorted picture. Commit-level analysis across all branches gives you the truth.
The teams that will win the next five years aren't the ones that adopt AI tools first. They're the ones that measure adoption accurately, understand its impact on their specific workflow, and optimize accordingly.
Download the sample AI Adoption Report to see what this looks like in practice, or start your free trial to generate your own.
See how one team combined AI adoption tracking with all-branch visibility to 10x their output.
Leaderboards make AI-driven improvements visible — here's the psychology.
See the full Warclick vs Jellyfish comparison for the AI Adoption section.
Stop guessing about AI adoption. Start measuring it. Warclick detects 10+ AI coding tools across every commit and branch — showing you who's using what, how often, and whether it's actually improving outcomes. Free for 7 days.
Frequently Asked Questions
What is AI adoption rate in software engineering?
AI adoption rate is the percentage of engineers on a team who used AI coding tools during a given measurement period. However, adoption rate alone is an incomplete metric — it measures whether engineers have AI tools available, not how deeply they're using them. A more useful companion metric is the AI commit rate: the percentage of commits that contain AI-assisted code. A team can have 90% adoption but 10% AI commit rate, meaning most engineers have tools installed but rarely use them.
How does Warclick detect AI tool usage in commits?
Warclick uses a three-tier classification system. "Confirmed" commits contain explicit machine-readable proof of AI involvement — co-authored-by tags from Claude, Cursor signatures, Copilot attribution headers, or known bot account patterns. "Likely" commits show strong behavioral patterns consistent with AI use — structured formatting, detailed commit messages, and velocity signals calibrated against known AI and non-AI users. "Manual" commits show no detectable AI signals. This approach is more reliable than binary AI/not-AI classification and lets leaders understand the confidence level behind every data point.
Is 84% AI adoption high compared to other engineering teams?
84% adoption is close to the Warclick platform average of 87% (Q1 2026 aggregate). The more revealing number is AI commit depth: this team's 84.1% AI commit rate is significantly above the 55% platform average. Most teams have similar adoption breadth but vary widely in depth — from teams using AI for 5% of commits to teams like this one where it's the primary workflow. Breadth of adoption matters less than depth of integration into daily work.
Do AI coding tools actually improve engineering productivity?
The evidence from teams on the Warclick platform points to yes — primarily through friction removal rather than raw speed increases. The clearest signal is junior developer ramp-up: teams with high AI adoption report new hires becoming independently productive faster than teams without AI tooling. Secondary signals include more thorough PR descriptions (less review friction), faster async collaboration, and more consistent commit messages. The strongest gains are not in lines of code per hour but in the total surface area of work engineers can handle confidently.
Should I mandate AI tool adoption or let it happen organically?
Based on the adoption patterns we observe across the platform, mandating a specific tool often works better than mandating usage broadly. Teams that converge on one primary tool (Claude being the most common on our platform in Q1 2026) show higher depth of adoption than teams with fragmented tool usage. Rather than mandating that engineers "use AI," a more effective approach is standardizing on one tool, building onboarding materials around it, and measuring commit-level depth monthly so leadership can spot teams that have installed tools but not integrated them.